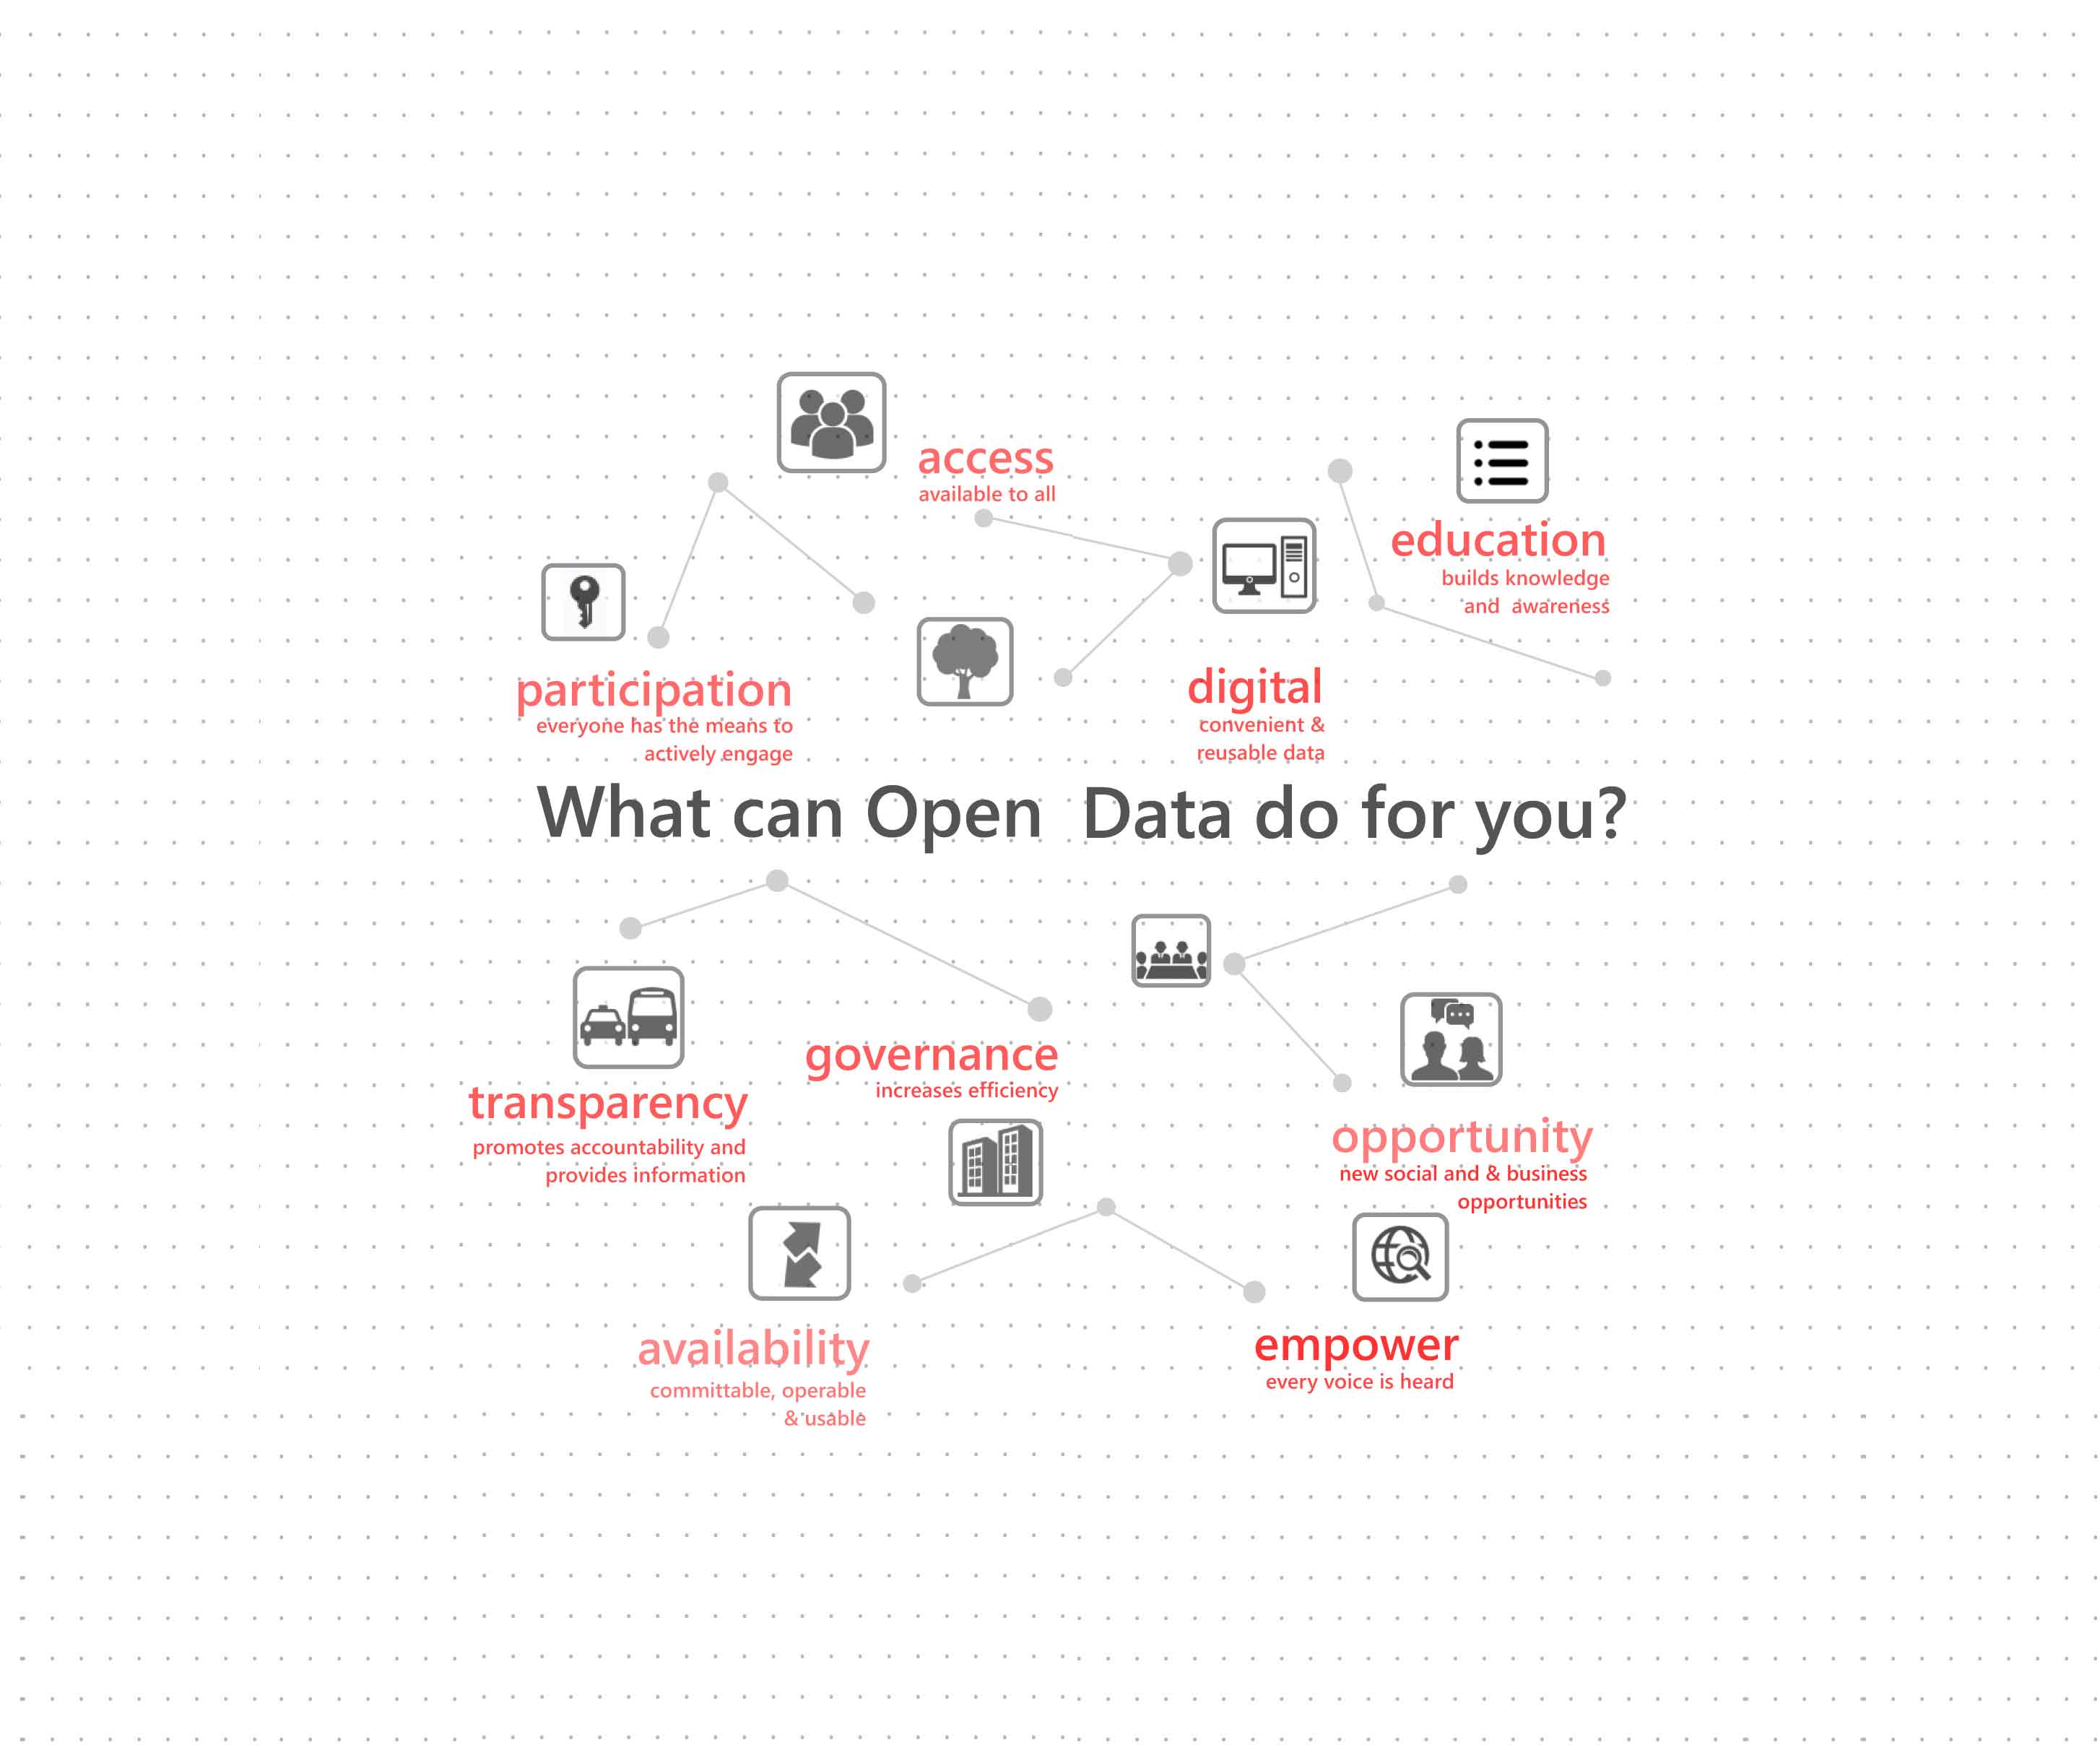
As part of the Digital Inclusion project, UDRI has developed a web-GIS database on Mumbai, www.loginmumbai.org. For many communities, the combination of broadband connectivity, access to online services and the opportunity to crowdsource information on their city is a powerful tool of empowerment and dialogue.
The GIS database currently contains around 150 maps on Mumbai under 10 Thematics: Ward Boundaries, Demography, Land use & Development plan, Housing, Transportation, Physical Infrastructure, Social Amenities, Environment, Livelihood and Governance.
Project Gallery :
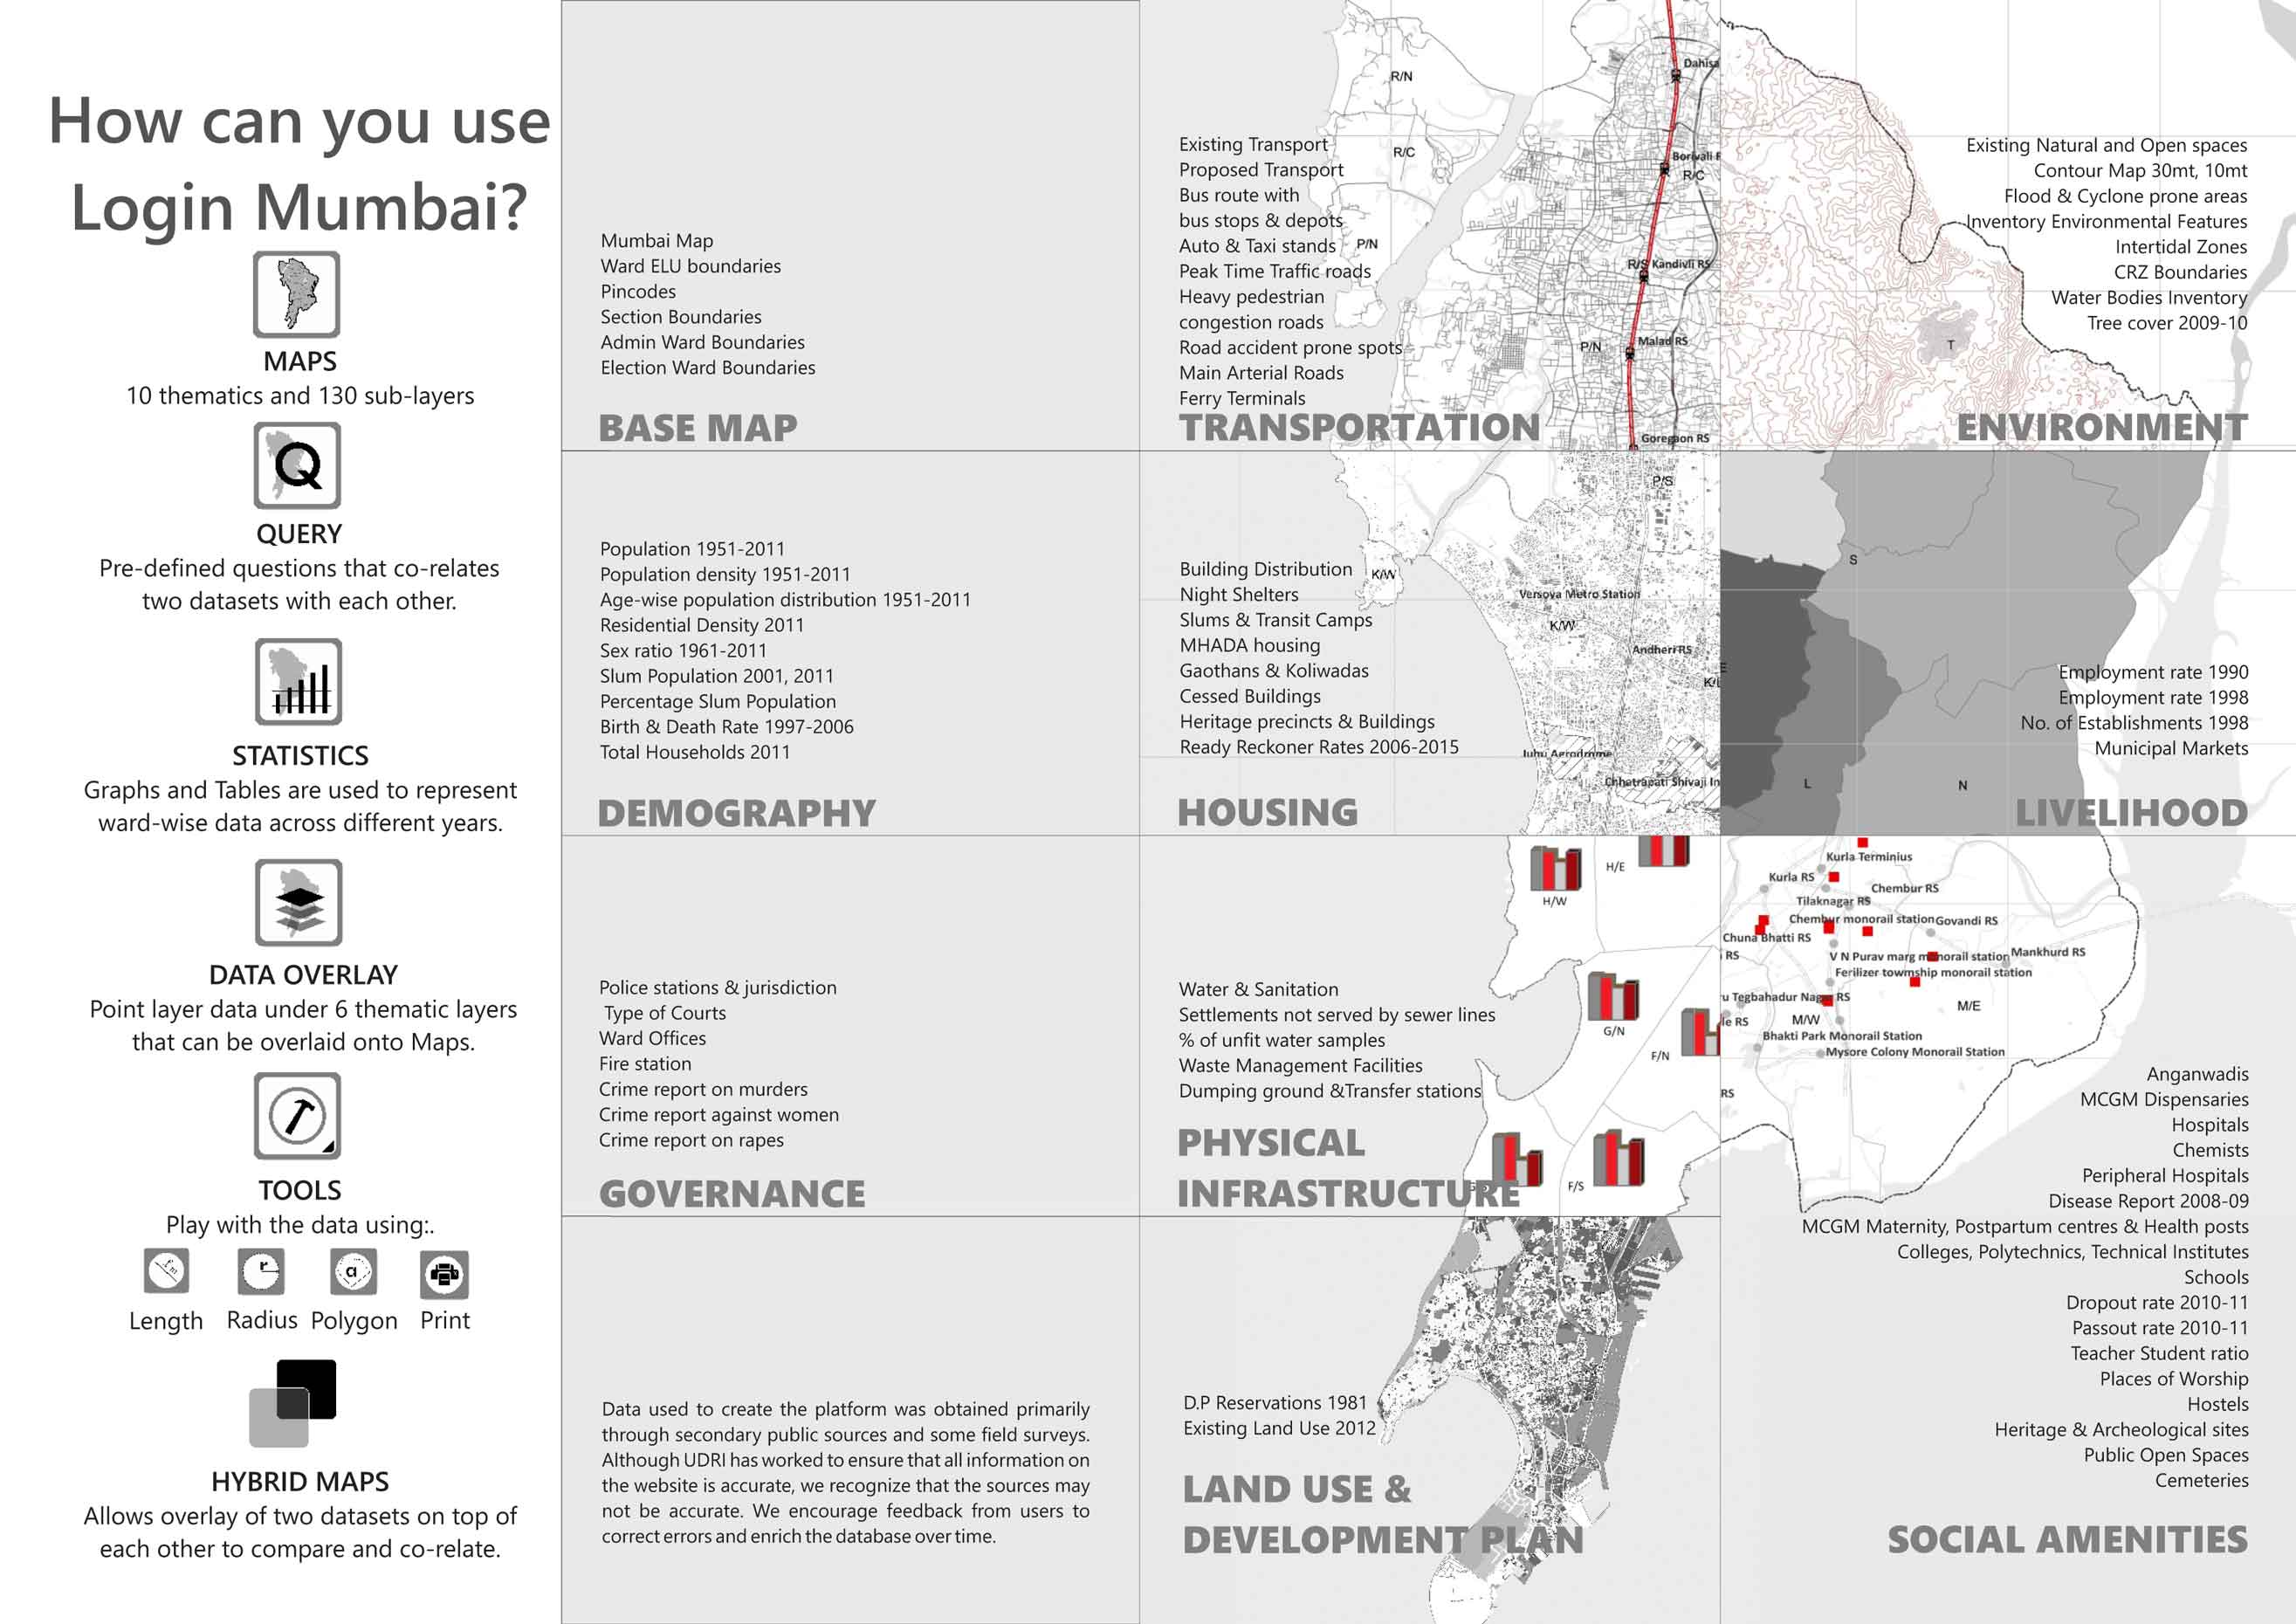
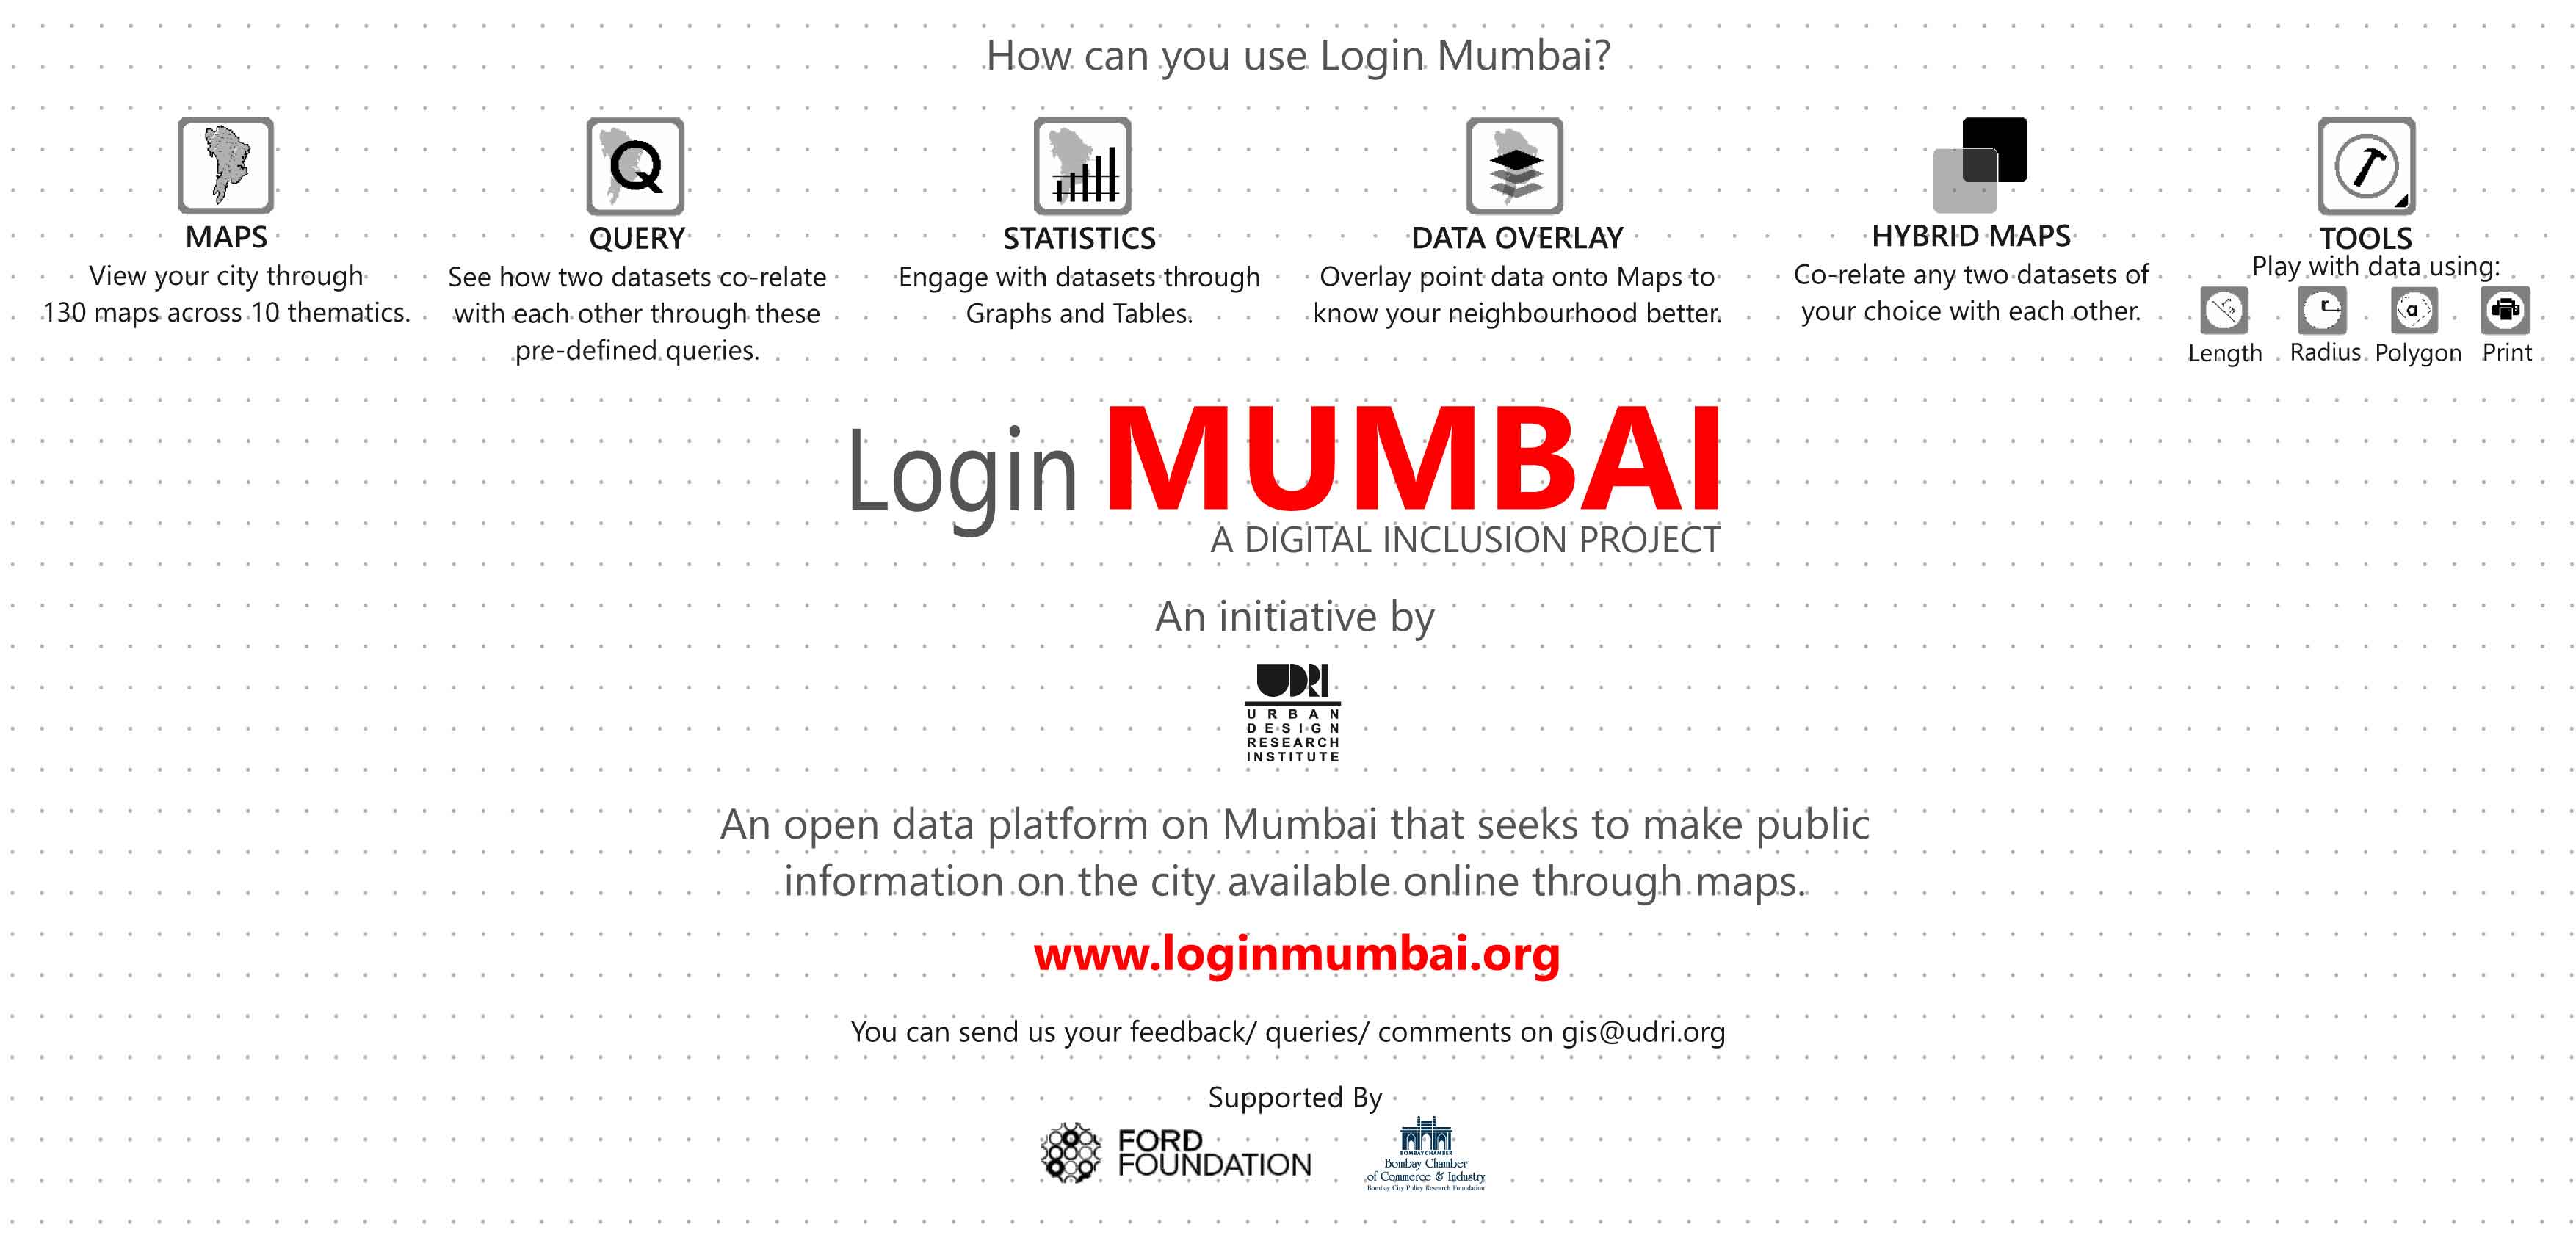
The web-GIS database contains 5 ways in which data can be viewed: Maps, Query, Statistics, Data Overlay and Tools. Maps displays datasets under 10 thematics for users to view a visual representation of public data. Query allows the user to view pre-defined questions that compare two or more datasets to analyse conditions. Statistics displays selected ward-wise data as graphs and tables. Data Overlay relates to point data such as schools, police stations, ward offices etc. that can be overlaid onto Maps to derive various co-relations. Tools allows a user to play with the data using the length, radius and polygon measure so that for instance, one can measure the distance from a railway station to any amenity or approximate walking distances to amenities from a location.
Login Mumbai is UDRI’s attempt to open up public information on the city, through maps, to NGOs, academic institutions, researchers and students who would otherwise not have access to this information in an otherwise restrictive policy environment for data sharing. The broader vision of open data also relates to access to internet connectivity whereby platforms such as LoginMUMBAI can reach several more people. In a related project on Digital Inclusion, UDRI is also advocating for universal access to high speed internet in the city as a public right.
Related Links :


